Invest with Direction The Best Stock Analysis Platform
Polarix makes investing clear. Search any stock for ten years of company filings, valuation metrics and analyst estimates, then project a price. Track your own portfolio, follow the news on the stocks you hold, learn what the numbers mean and more. All in clean, honest charts.
Get started in minutes
Bring your portfolio.
We do the rest.
Import from your broker, upload a CSV or add your holdings, and we rebuild your real returns for you.
Upload your broker
Upload a CSV export from your broker, or add your trades by hand.
We rebuild the numbers
Cost basis, true returns, dividends and diversification, computed from every transaction, automatically.
Track & compare
Watch your portfolio grow and see exactly how you stack up against the market.
The whole picture
Your portfolio,
one honest view.
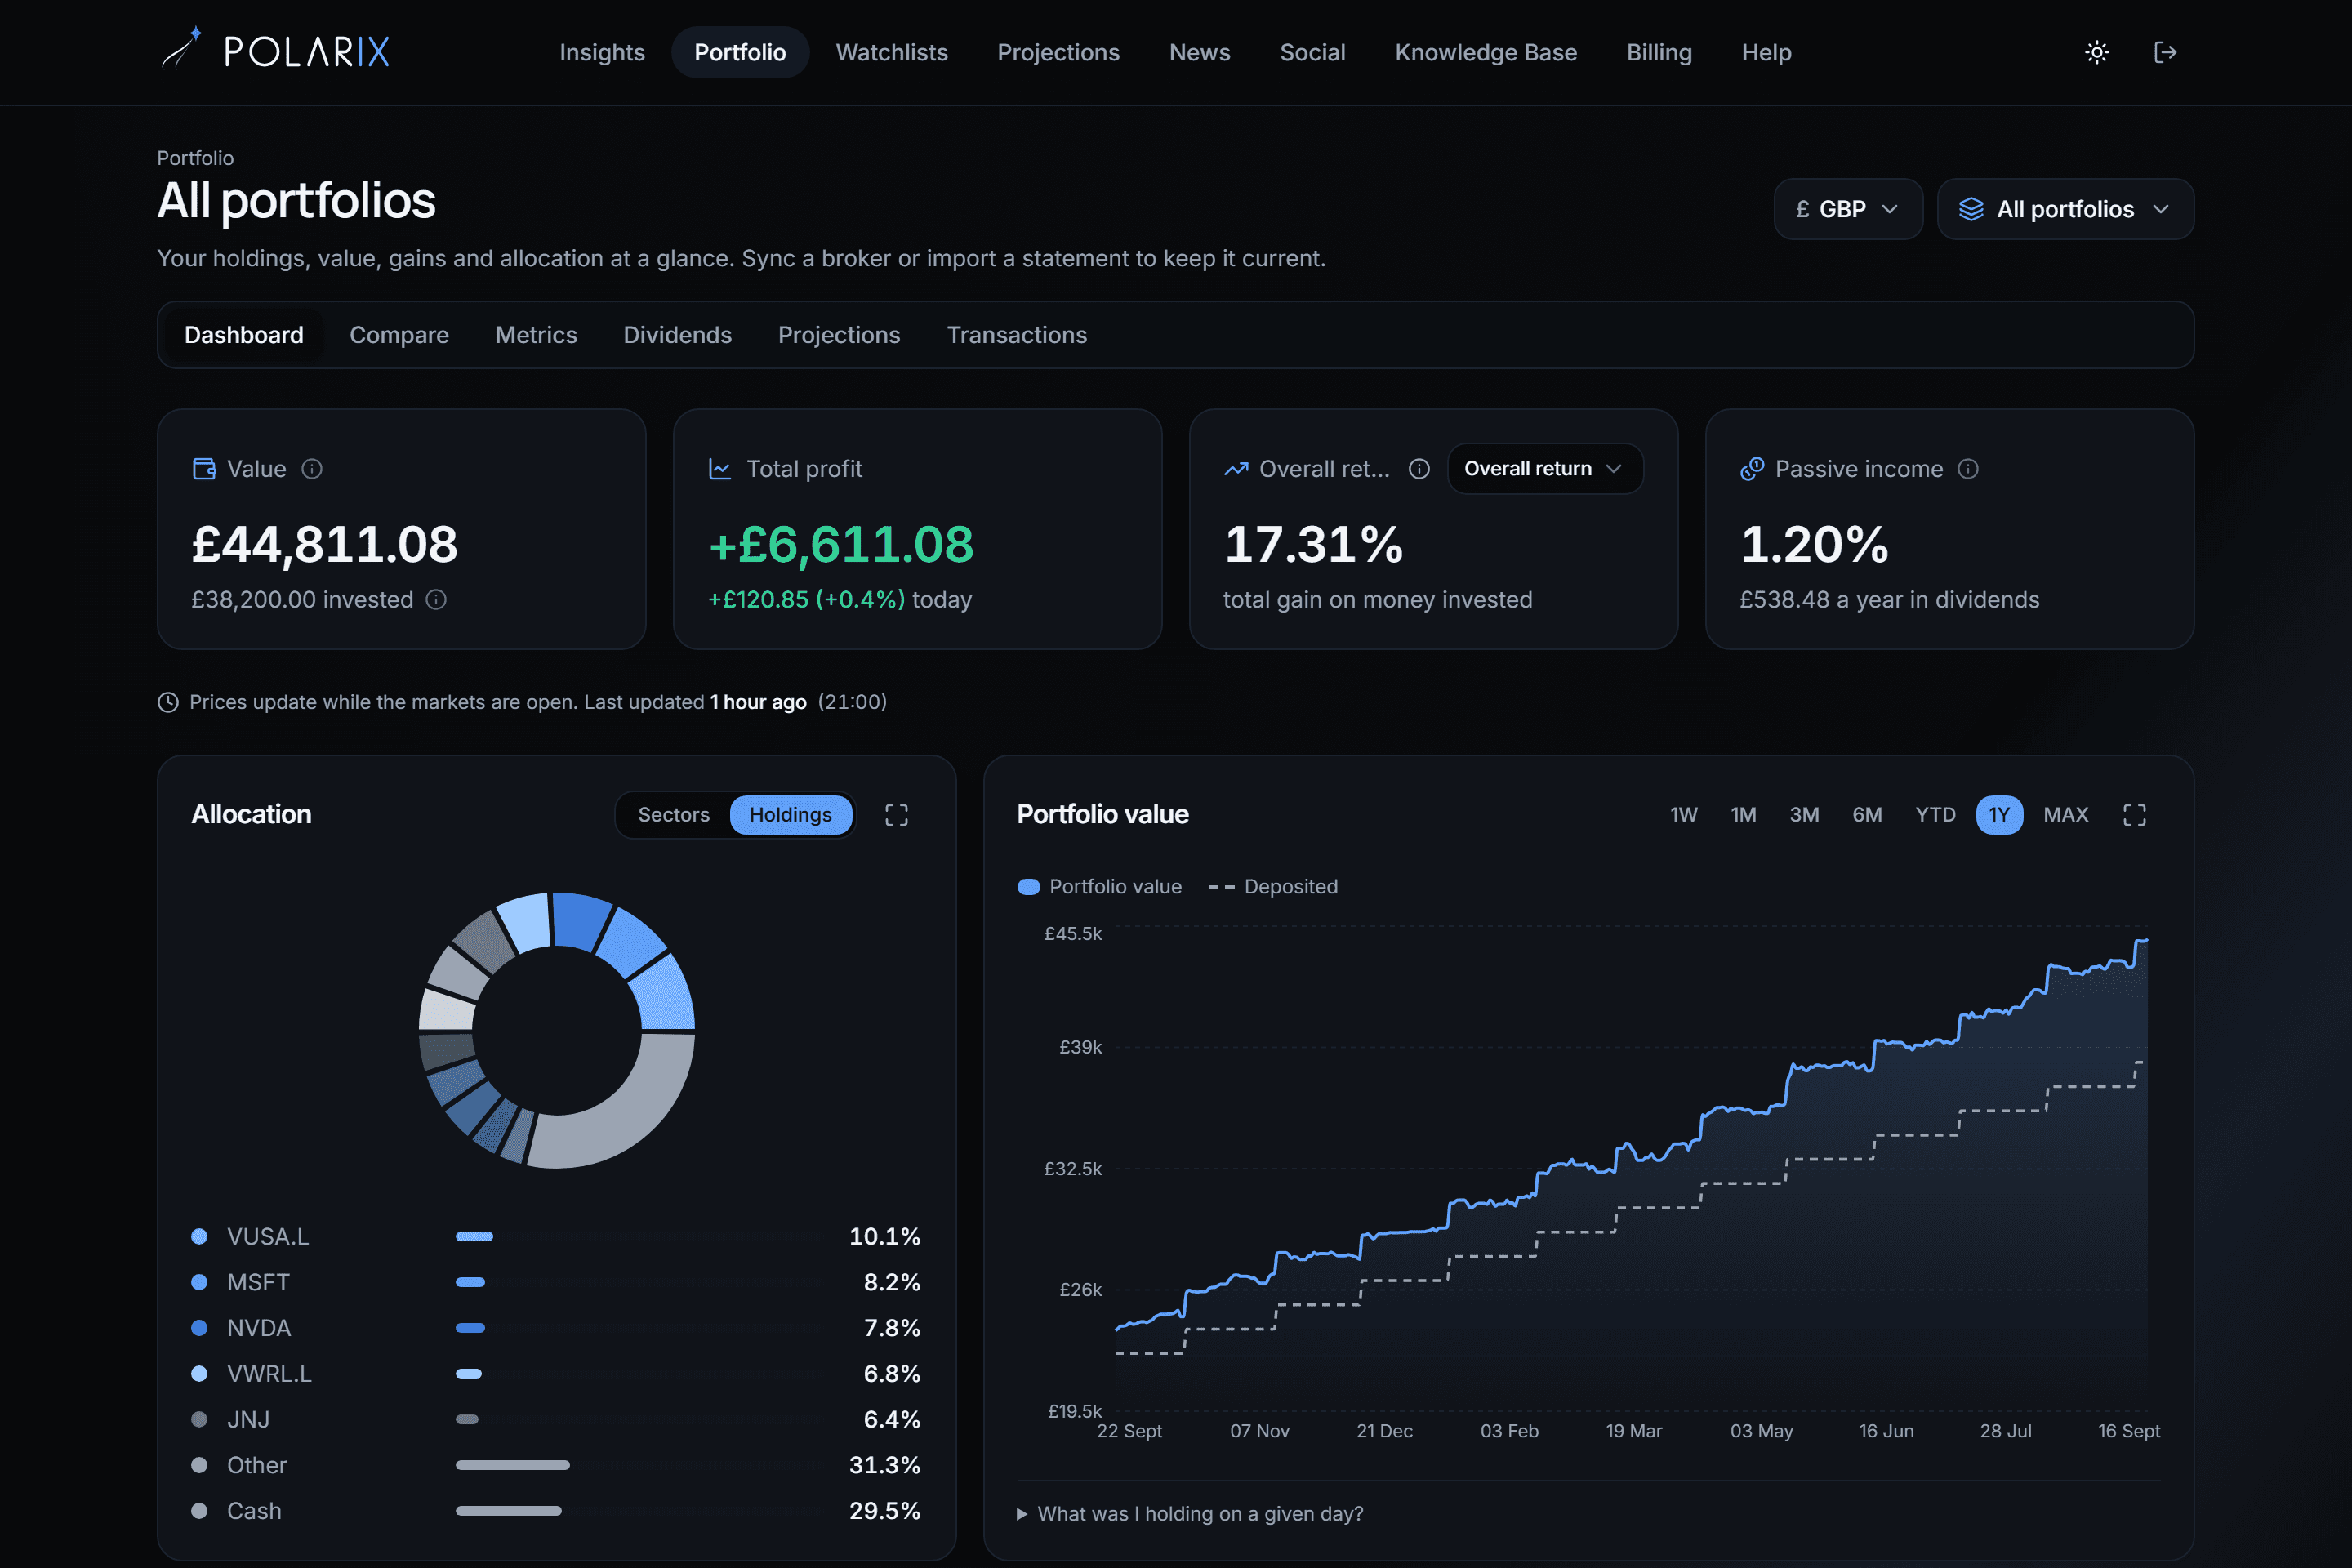
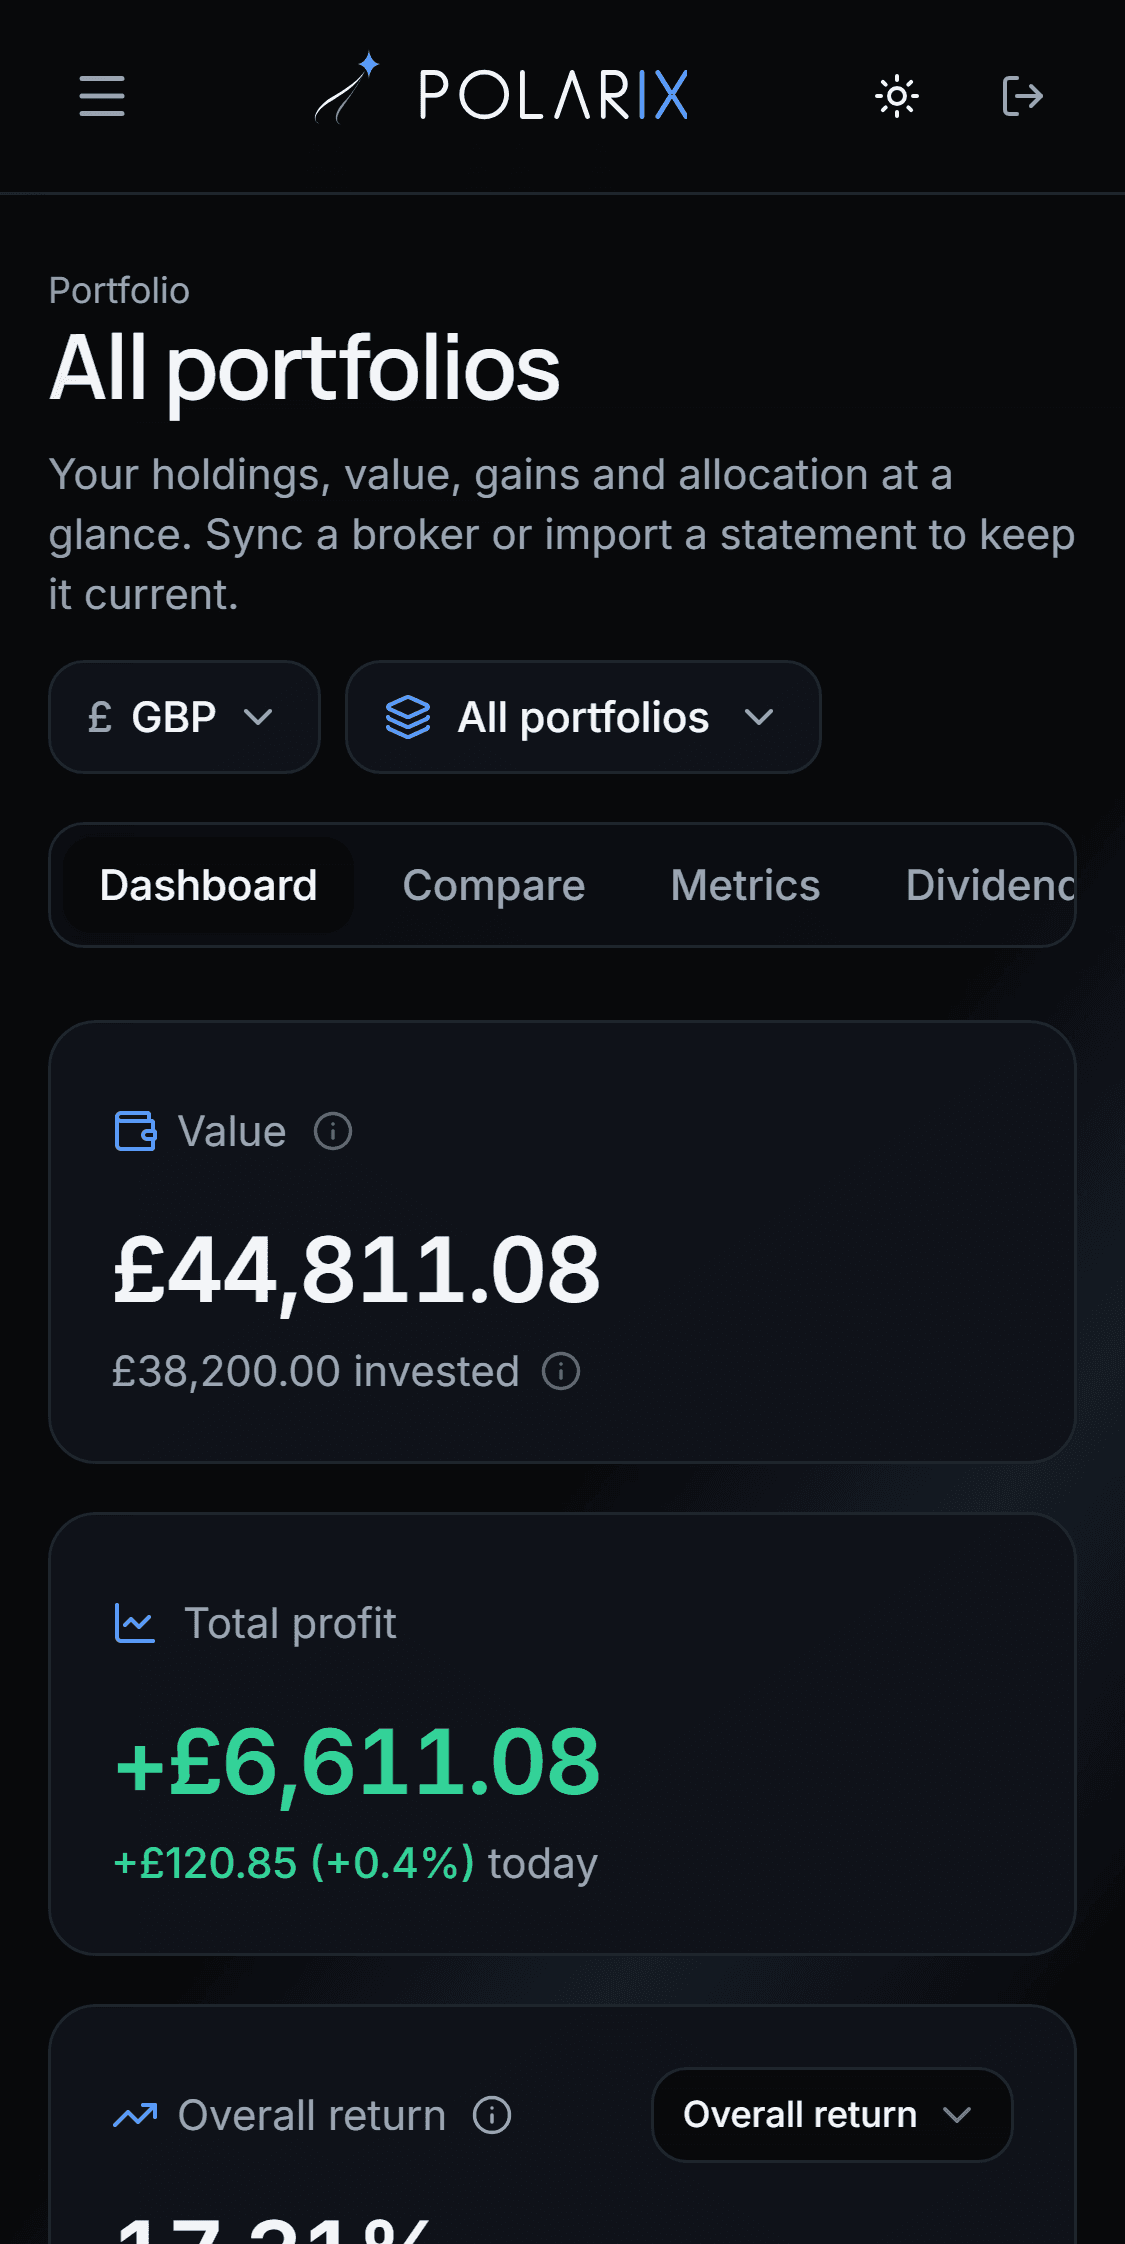
Value, true return, dividends and diversification, rebuilt from every transaction.

What you get
Everything you need.
Nothing you don’t.
Stock Insights
Search any stock for its price history, valuation metrics and company profile. Ten years of annual figures come straight from company filings, with analyst estimates alongside.
Portfolio Tracker
Import a CSV from any of twenty brokers and see what your money has actually done: true returns, UK cost basis, dividends and diversification. Compare it against a benchmark over any period.
Watchlists
Keep as many lists as you like and open any stock for its price, metrics and latest news. The dip finder sorts a list by how far each name has fallen over the period you pick.
Projections
Model a share price up to five years out from either earnings or cash flow, with bull, base and bear cases side by side. Each case is drawn as a range rather than a single line, and you can save the ones worth revisiting.
News
Market headlines from the past day, filtered down to what is worth reading. Every stock page and watchlist carries its own feed too.
Social
Post what you are buying and why, and see what everyone else is. Add friends by name or email and keep it all in one feed.
Knowledge Base
Ten plain-English lessons covering the three financial statements, margins, moats, valuation, dividends and measuring your real return. Written to be understood rather than memorised.
Help
Answers to the questions that come up most, weighted towards importing, where most problems start. If something still looks wrong, one email reaches us.
One price. Everything in it.
No tiers, no upsells, nothing locked away. Free until 1 November, then one price for the whole thing.
Free until 1 November
Everyone is free until 1 November, whenever you join. Sign up in the last week and you still get a full 7 days. We take your card when you sign up and charge it when the free period ends.
- Unlimited portfolios & holdings
- Full stock insights and financials
- Dividends, projections & comparisons
- Watchlists and tailored news
Cancel any time. Your data stays yours and stays readable either way.